What Is an S-Curve in Construction?
An S-curve is a graph that plots cumulative progress, cost or resource use against time for a project. It takes an S shape because work starts slowly, speeds up in the middle of the project and slows again near the end. Planned and actual curves are compared to show whether the project is ahead or behind.
Why the curve has an S shape
Early weeks involve mobilisation and preparation, so little is completed. Mid-project, many trades work at once, so the curve rises steeply. Towards the end, finishing, testing and snagging slow the rate again. The cumulative total rises smoothly from nought to one hundred percent, which gives the S.
How to read an S-curve
Plot the planned (baseline) curve, then add actual progress each period and compare:
- Actual above planned: ahead of programme.
- Actual below planned: behind programme.
- A widening gap shows a trend worth acting on early.
- Cost or resource S-curves show cash-flow and manpower needs over time.
How to build one
Weight each activity by its cost or man-hours, spread that value across its duration, and add the periods together as a running total. Plot the cumulative percentage against time. Our S-curve generator turns your activities into a curve, and a Primavera programme can also be used as the source of the planned values.
S-curves on Gulf projects
Gulf clients and consultants commonly ask for a planned versus actual S-curve in monthly progress reports, and sometimes separate curves for cost and for manpower. Follow the weighting method required by your contract or reporting specification so the figures can be compared.
How Arkan shows the S-curve
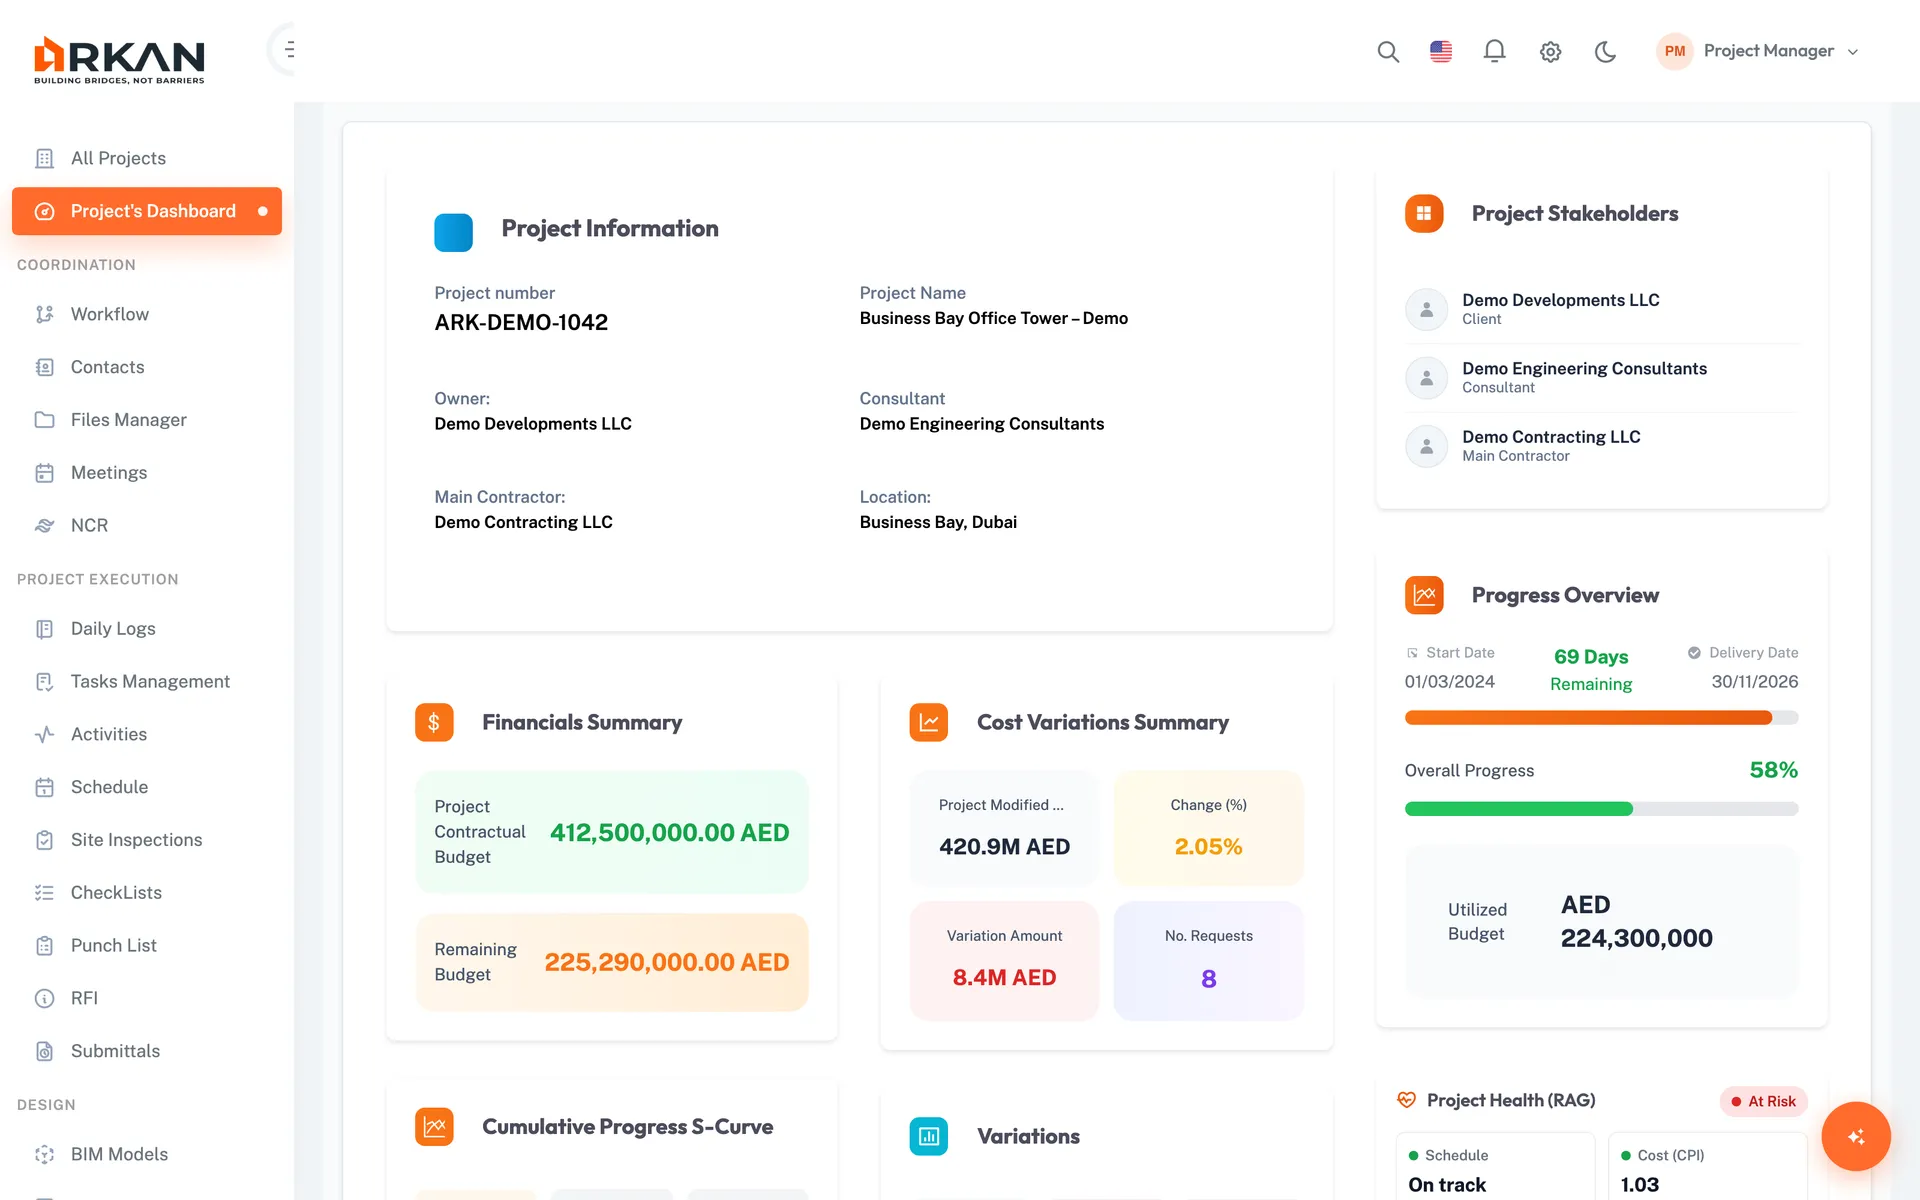
The project dashboard includes a Cumulative Progress Curve widget.
- The Cumulative Progress S-Curve widget visualises project progress over the last 12 months.
- The dashboard also shows a Financial Summary and progress overview alongside it.
- Schedule data comes from the Primavera P6 files uploaded to the project.
Frequently asked questions
What does an S-curve show?
It shows cumulative progress, cost or resources over time. Comparing planned and actual curves shows whether the project is on track.
What is a baseline S-curve?
It is the planned curve built from the approved baseline programme, against which actual progress is compared.
Is an S-curve a forecast?
The planned curve is a plan. A forecast curve can be added by projecting the remaining work from current performance, but it should be labelled as an estimate.
Related terms
Related calculators
Read next
Last updated: 2026-10-14. Definitions are general guidance. Your contract and project procedures govern.