Overview
The Schedule & Primavera module in Arkan provides a comprehensive project scheduling solution built around Oracle Primavera P6 integration. You can upload Primavera schedule files (.xml or .xer), visualize activities in both Grid and Gantt views, track activity completion, monitor critical path analysis, and compare different schedule versions over time. The Schedule Dashboard brings together KPI cards, charts, and activity tables so you can assess schedule health at a glance.
Prerequisites
Before using the Schedule & Primavera module, ensure the following:
- You have an active Arkan account with the Schedule Upload permission assigned to your role.
- A project has been selected in the project selector (top navigation bar).
- You have a Primavera P6 export file in
.xmlor.xerformat, with a maximum file size of 50 MB. - If you plan to link schedule activities to inspections or other modules, those modules should already be configured for the selected project.
Tip: If you see an "Access Denied" message when navigating to the Schedule page, contact your system administrator to verify that Retrieve permission is enabled for your role on the Schedule Upload page.
Navigating to the Schedule Module
Sidebar > Schedule
The Schedule Dashboard is the primary landing page. The module also has a dedicated Primavera file management route accessible via Sidebar > Primavera.
Section 1: Schedule Dashboard
The Schedule Dashboard is the main landing page (route: /schedule-dashboard). It provides a consolidated view of your project schedule with KPIs, activity charts, and detailed activity tables.

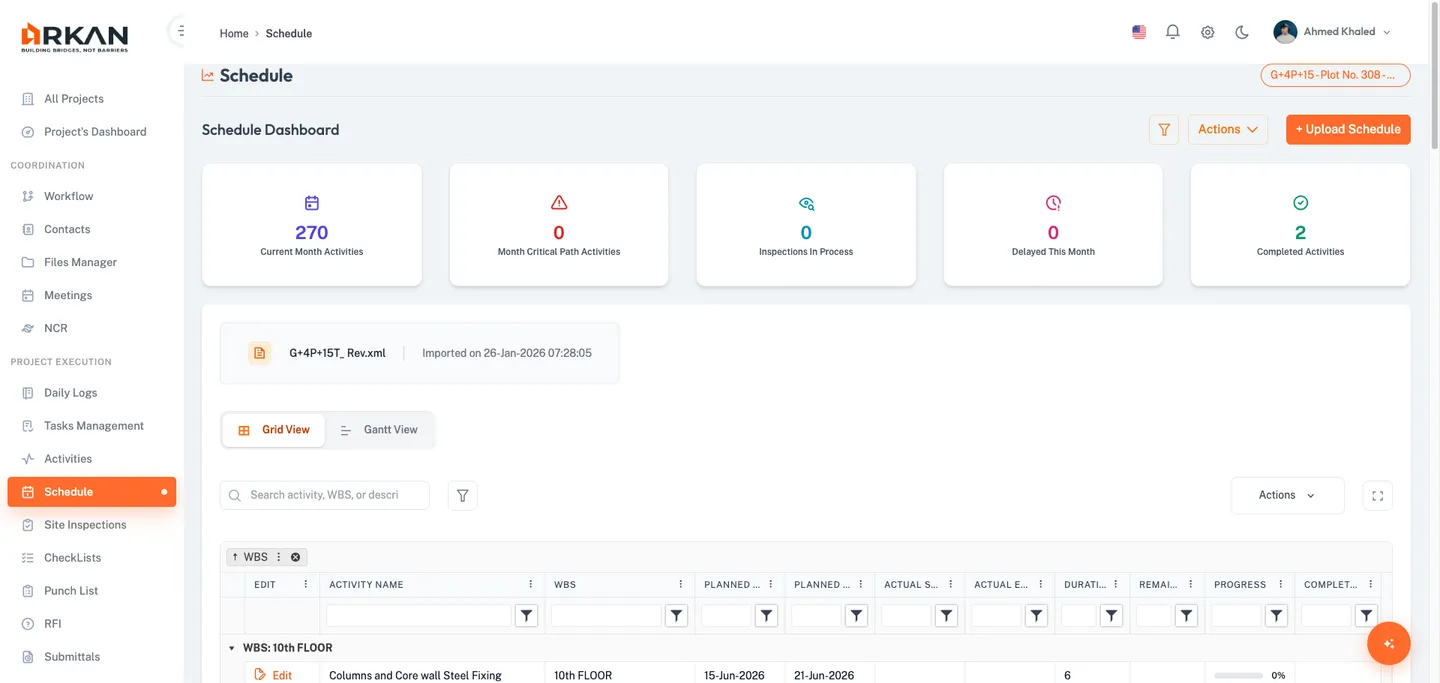
1.1 Page Header and KPI Cards
The page header displays the Schedule title, a Project badge, a Filter toggle button, an Actions dropdown, and an Upload Schedule button (visible only with Insert permission).
When at least one schedule file has been uploaded, five KPI cards appear:
| Card | Description |
|---|---|
| Total Activities | Total number of activities across the selected schedule file |
| Completed | Count of activities at 100% completion |
| In Progress | Count of activities that have started but are not yet complete |
| Not Started | Count of activities that have not yet begun |
| Completion Rate | Overall percentage of project completion |
These values update automatically when you select a different schedule file or refresh the data.

1.2 Filter Panel and File Selector
- Click the Filter toggle button (funnel icon) to expand the collapsible filter panel.
- Enter text in the Search Activities field to search by activity name or WBS.
- Click Clear to reset all filter fields, or the close button (X) to collapse the panel.
When multiple schedule files exist, a file selector card appears above the Grid/Gantt views:
- Click the file selector card showing the current file name and import date.
- A dropdown list appears showing all available schedule files.
- Click a file to select it. The dashboard refreshes with the new file's activities.

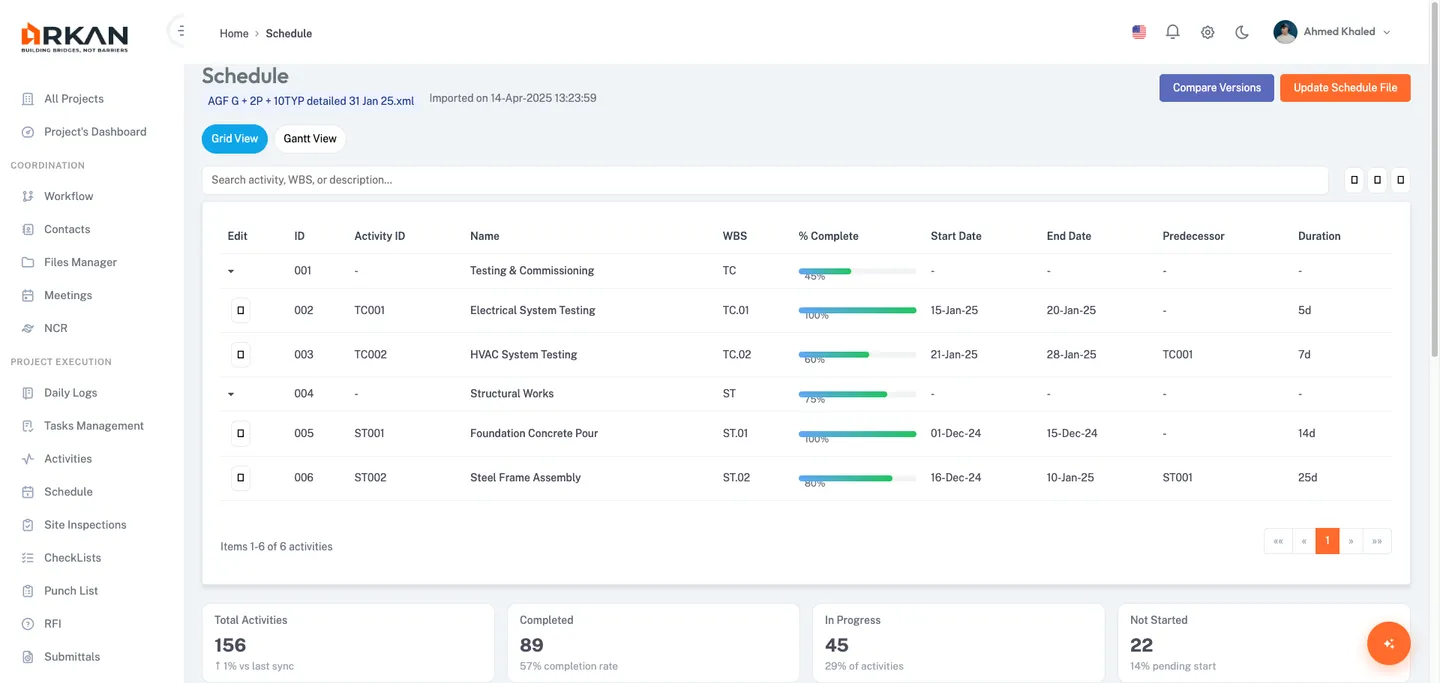
1.3 Grid View
The Grid View is the default display mode. Ensure the Grid View tab is active.
| Column | Description |
|---|---|
| Edit | Opens the Completion Ratio dialog for that activity |
| Activity Name | Name/title of the activity |
| WBS | Work Breakdown Structure code |
| Planned Start / End | Scheduled start and end dates |
| Actual Start / End | Actual start and end dates (if available) |
| Duration | Original duration in days |
| Remaining | Remaining duration in days |
| Progress | Visual progress bar with percentage label |
| Complete Date | Date the activity was marked complete |
| Total Float / Free Float | Float days (Total Float hidden by default; zero shown in red) |
Additional hidden columns include Activity ID and Predecessor. Use the column menu (right-click header) to show/hide columns. Columns are sortable, filterable, reorderable, and resizable. Page size options: 5, 10, 20, 50, 100.
Tip: Drag a column header into the grouping area above the grid to group activities -- useful for grouping by WBS.
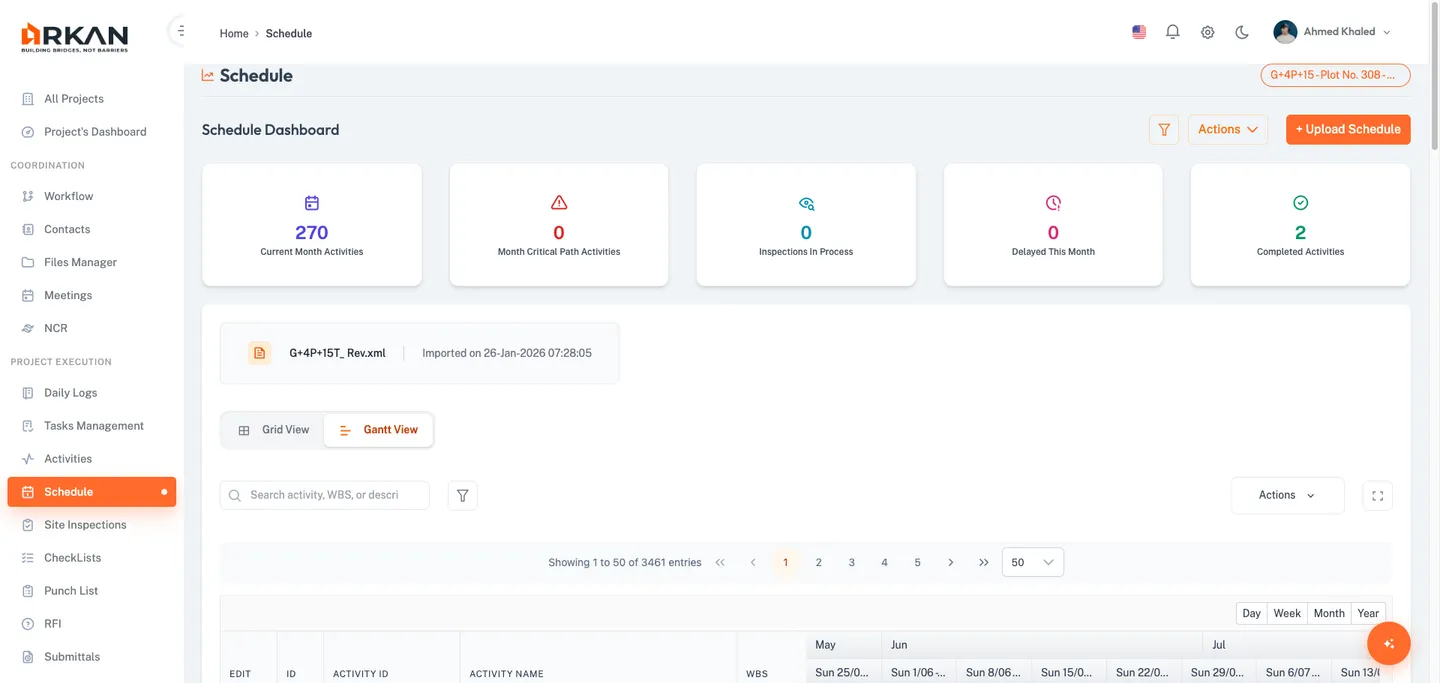
1.4 Gantt View
- Click the Gantt View tab (icon with horizontal bars).
- The Kendo Gantt chart loads with a table section (left) and timeline section (right).
- Columns include: ID, Activity ID, Activity Name, WBS, Progress, Start/End Date, Predecessor, Duration, Remaining, and Complete Date.
- The timeline supports Day, Week, Month, and Year zoom levels.
- Each task bar displays:
[45%]: Foundation Concrete Pour. - Use the paginator above the chart to navigate through large activity sets.

Warning: For projects with thousands of activities, use the paginator to limit the visible set. Rendering too many tasks at once may impact browser performance.
1.5 Advanced Filter Dialog
- Click the Filter button (funnel icon) next to the inline search bar.
- The Filter Activities dialog opens with the following fields:
| Field | Description |
|---|---|
| Year / Month | Filter activities by start year and month |
| Activity ID / Name | Filter by activity ID or name (contains match) |
| Start Date From / To | Date range for planned start |
| End Date From / To | Date range for planned end |
| WBS Name | Filter by WBS name (contains match) |
| Original Duration | Filter by minimum original duration |
- Click Apply Filter to apply, Clear to reset, or Cancel to close.
1.6 Expected Project End Date (CPM Analysis)
Below the Grid/Gantt section, a Critical Path Method analysis card displays:
| Metric | Description |
|---|---|
| Expected End | Projected completion date based on current progress |
| Baseline End | Original baseline completion date |
| Schedule Status | On Schedule, Ahead of Schedule, or Behind Schedule |
| Variance (Days) | Days ahead (+) or behind (-) the baseline |
| Overall Completion | Completion percentage with a progress bar |
An additional stats row shows Total Activities, Completed, In Progress, and Critical Path Activities counts.
1.7 Charts and Activity Tables
Two charts appear side by side below the CPM analysis:
- Current Month Activities Overview (bar chart) -- activity distribution for the current month.
- Activities Overview (pie chart) -- status breakdown with info cards for Last Inspected Phase and Critical Path Activities.
Four sortable activity tables appear in a 2x2 grid at the bottom of the dashboard:
| Table | Description |
|---|---|
| Upcoming to Start | Activities scheduled to start soon |
| Upcoming to Complete | Activities nearing their planned completion |
| Delayed Activities | Activities that are behind schedule |
| Completed This Month | Activities completed during the current month |
Section 2: Uploading a Primavera File
You can upload schedule files from the Upload Schedule button on the Schedule Dashboard or via the Primavera page (Sidebar > Primavera).
2.1 Upload from Schedule Dashboard
- Navigate to Sidebar > Schedule.
- Click the Upload Schedule button in the section header.
- The Upload Schedule File dialog opens, showing a grid of previously uploaded files.
- In the Select File section, click the file browser or drag and drop a
.xmlfile. - The file appears in the details table with fields for Reference No, Issue Date, Expiry Date, Document, and Status.
- Enter a Reference No (required). Optionally set Issue Date and Expiry Date.
- Review the validation summary: green = ready, orange = fix errors.
- Click Upload. A progress indicator appears.
- If the file contains multiple Primavera projects, select the target project from the dropdown that appears.
- The file uploads and appears in the files grid with a success notification.
Warning: Only
.xmlfiles are accepted from the Schedule Dashboard. Maximum file size is 50 MB.
2.2 Upload from Primavera Page
- Navigate to Sidebar > Primavera and click Upload File.
- A dialog opens with a drag-and-drop zone. Supported formats:
.xml,.xer. Max: 50 MB. - Select or drop a file. The file name and size appear below the upload zone.
- Click Upload. A progress bar shows upload status.
- If multiple projects are detected, select the correct one and click Continue.
- The dialog closes and the files table refreshes.
Section 3: Primavera Files Management
The Primavera Files page (route: /primavera/upload) manages all uploaded schedule files.
3.1 Files Table
| Column | Description |
|---|---|
| ID | System-generated file identifier |
| File Name | Uploaded file name with type icon |
| Primavera Project | Project name from the Primavera file |
| Uploaded By | User who uploaded the file |
| Upload Date | Upload date and time |
| Actions | View Gantt and Delete buttons |
Server-side pagination with page sizes: 10, 25, 50, 100.
3.2 Filtering and Exporting
- Click Filter to open the Filter Schedule Files dialog with fields: File ID, File Name, Upload Date range, Uploaded By, and Document Type.
- Click Apply Filter to filter, or Clear to reset.
- Use the Excel (green icon) or PDF (red icon) buttons to export the files list.
3.3 Deleting a File
- Click the Delete button (trash icon) in the Actions column.
- A confirmation dialog appears.
- Click Accept to confirm, or Cancel to abort.
Warning: Deleting a schedule file is permanent and removes all associated activity data.
Section 4: Viewing the Gantt Chart
Open the Gantt viewer from the Primavera files table or navigate to /primavera/gantt/:id.
4.1 Gantt Chart Layout
The header displays the file name, uploaded by/date, a Table/Timeline toggle, and a Filter button.
Table View columns: Activity ID (monospaced), Title, WBS, Start/End Date, Duration, Remaining, Completion (progress bar), and Approvals count. Pagination: 10, 20, 50, 100.
Timeline View displays activities as interactive cards with title, ID, WBS, date range, duration, approval count, and progress bar. Completed activities show a green check; in-progress show a blue clock.
4.2 Filtering in the Gantt Viewer
- Click Filter in the Gantt header.
- Filter by Activity ID, Title (contains match), WBS (dropdown), Year (auto-populated), or Month.
- Click Apply Filter or Clear to reset.
Section 5: Updating Activity Completion
5.1 Editing Completion Ratio
- On the Schedule Dashboard (Grid or Gantt View), click the Edit link for the target activity.
- The Edit Completion Ratio dialog opens.
- Enter the Completion Ratio (0--100, up to 2 decimal places).
- If the ratio is set to 100%, a Completion Date field appears (required). Select the date.
- Click Save.
- The system saves the update, shows a success notification, and refreshes the grid.

Tip: Each completion update is recorded in the activity completion history, providing an audit trail of who updated the ratio, when, and to what value.
Section 6: Version Comparison
6.1 Comparing Two Schedule Versions
- On the Schedule Dashboard, click Actions > Compare Versions.
- The Compare Schedule Versions dialog opens.
- Select the Base Version (older file) and Compare Version (newer file) from the dropdowns.
- Click Compare Versions. A loading spinner appears during processing.
6.2 Reading Comparison Results
Four summary cards display the counts:
| Card | Color | Description |
|---|---|---|
| Added | Green | Activities in Compare Version but not in Base Version |
| Removed | Red | Activities in Base Version but not in Compare Version |
| Modified | Yellow | Activities in both versions with changed values |
| Unchanged | Gray | Identical activities across both versions |
Tab buttons below the summary cards show detailed grids:
- Added / Removed tabs -- Activity ID, Name, WBS, Start, End, Duration.
- Modified tab -- Activity ID, Name, and a Changes column showing field-level diffs (e.g.,
duration: 14 -> 21).
The dialog automatically selects the tab with the most changes.
Section 7: Exporting Schedule Data
- On the Schedule Dashboard Grid View, click Actions > Export Excel or Export PDF.
- Downloads
primavera-activities.xlsxorprimavera-activities.pdf(A4 landscape). Exports include all pages. - On the Primavera Files page, use the Excel or PDF buttons to export the files list.
Troubleshooting
| Issue | Possible Cause | Resolution |
|---|---|---|
| "Access Denied" message | Missing Schedule Upload permission | Contact your administrator to grant permissions |
| Upload fails | File exceeds 50 MB or unsupported format | Use .xml or .xer files under 50 MB |
| No activities after upload | Multiple projects in file, none selected | Re-upload and select the correct Primavera project |
| Gantt chart is slow | Too many activities rendered | Use the paginator; apply filters to narrow data |
| Completion ratio won't save | Validation issue | Ensure ratio is 0--100; provide completion date if 100% |
| Version comparison empty | Identical files selected | Select two different schedule file versions |
| KPI cards show zeros | Data still loading or no activities | Wait for loading to complete; try a different file |
| Filters return no results | Criteria too restrictive | Click Clear and apply fewer criteria |
Tip: If the dashboard loads slowly, use filters or the Grid View (which paginates more efficiently than the Gantt View) to limit the visible data set.
Next: Finance
Back to: Help Center