Prerequisites
- You must be logged in to Arkan with a valid account (see Getting Started).
- You must have a project selected. If you have not yet selected a project, see Getting Started -- Selecting a Project.
- Your user role must include Dashboard -- Retrieve permission. If you see an "Access Denied" message, contact your administrator.
Accessing the Dashboard
- In the Sidebar, click Dashboard under the Main section.
The Project Dashboard loads and displays an overview of the currently selected project.

Tip: You can also reach the dashboard by clicking the Home segment in the breadcrumb navigation at the top of any page.
- If no project is selected, you will see the message "No project selected. Please select a project first." Navigate to All Projects in the sidebar to select one.
The dashboard route is /dashboard. Each widget section loads independently, so you may see skeleton loading indicators as individual sections fetch their data.
Dashboard Layout
The dashboard is organized into three visual zones: a main content area (left), a sidebar column (right), and a full-width bottom row.
Left Column (Main Area)
| # | Widget | Description |
|---|---|---|
| 1 | Project Information | Core project details at a glance |
| 2 | Financial Summary | Contractual and remaining budget |
| 3 | Cumulative Progress Curve | S-curve chart of project progress over time |
| 4 | Inspection Overview | Approved, In Process, and Returned inspection counts |
| 5 | Cost Variations Summary | Modified budget, change percentage, variation amount, number of requests |
| 6 | Variations | Additions, deductions, and net variation with bar chart |
| 7 | BOQ Items Status | Locked and on-hold BOQ item counts |
| 8 | Inspection Projection | Bar/line chart projecting inspection trends |
Right Column (Sidebar)
| # | Widget | Description |
|---|---|---|
| 9 | Project Stakeholders | Owner, Consultant, and Contractor companies with logos |
| 10 | Progress Overview | Timeline progress bar, overall completion, and utilized budget |
| 11 | Activities Overview | Last inspected phase, upcoming critical path activities, and completion donut chart |
| 12 | Estimated Financial Projection | Total till date and difference from last payment |
Bottom Row (Full Width)
| # | Widget | Description |
|---|---|---|
| 13 | In-Process Inspection Table | Tabular list of inspections currently under review |
| 14 | Workflow Requests Overview | Stacked bar chart of workflow request statuses |
| 15 | Upcoming Activities to Start | Sortable grid of activities scheduled to begin soon |
| 16 | Upcoming Activities to Complete | Sortable grid of activities approaching their finish date |
| 17 | Submittals Overview | Submittal KPI cards, discipline/status charts, and upcoming submittals table |

Reading Dashboard Widgets
Each widget on the dashboard falls into one of four categories. Understanding these categories helps you interpret the data at a glance.
KPI Cards
KPI cards display a single metric with a label and a large formatted value. They use color-coded backgrounds to convey meaning:
- Green background -- Positive or healthy values (e.g., Contractual Budget, Approved inspections)
- Orange/amber background -- Caution or in-progress values (e.g., Remaining Budget, In-Process inspections)
- Red background -- Attention-required values (e.g., Variation Amount, Delayed submittals)
- Purple/blue background -- Informational counts (e.g., Number of Requests, Locked BOQ items)
Charts
Charts visualize trends and comparisons. The dashboard uses:
- Line/area charts (Cumulative Progress Curve) -- Show progress over the last 12 months
- Bar charts (Variations, Workflow Requests) -- Compare categories side by side
- Donut charts (Activities Overview) -- Show proportional breakdowns
- Projection charts (Inspection Projection) -- Forecast future trends
Tip: Hover over any chart data point to see a tooltip with the exact value.
Progress Bars
Progress bars appear in the Progress Overview widget. There are two bars:
- Orange bar (Timeline Progress) -- Shows how much calendar time has elapsed between the project start date and delivery date.
- Green bar (Overall Progress) -- Shows the schedule-based completion percentage from Primavera.
Data Tables
Tables display detailed records with sorting and pagination. The Upcoming Activities grids and In-Process Inspection Table support:
- Click a column header to sort ascending or descending.
- Use the page controls at the bottom to navigate through records.
- Adjust page size (5, 10, or 20 rows per page) using the page-size dropdown.
Project Information Card
The Project Information card is the first widget in the main area. It shows six key fields:
- Open the dashboard. The Project Information card appears at the top left.
- Review the following fields:
- Project Number -- The unique project code
- Project Name -- The full name of the project
- Owner -- The project owner company
- Consultant -- The consulting company assigned to the project
- Main Contractor -- The primary contractor company
- Location -- The country and city of the project (displayed as Country/City)
These values are read-only on the dashboard. To edit project details, navigate to Project Settings.

Financial KPIs
Financial Summary
- Locate the Financial Summary widget below the Project Information card, on the left side.
- Review the two budget indicators:
- Project Contractual Budget (green card) -- The total contracted value of the project, displayed in the project currency.
- Remaining Budget (orange card) -- The budget remaining after expenditures to date.
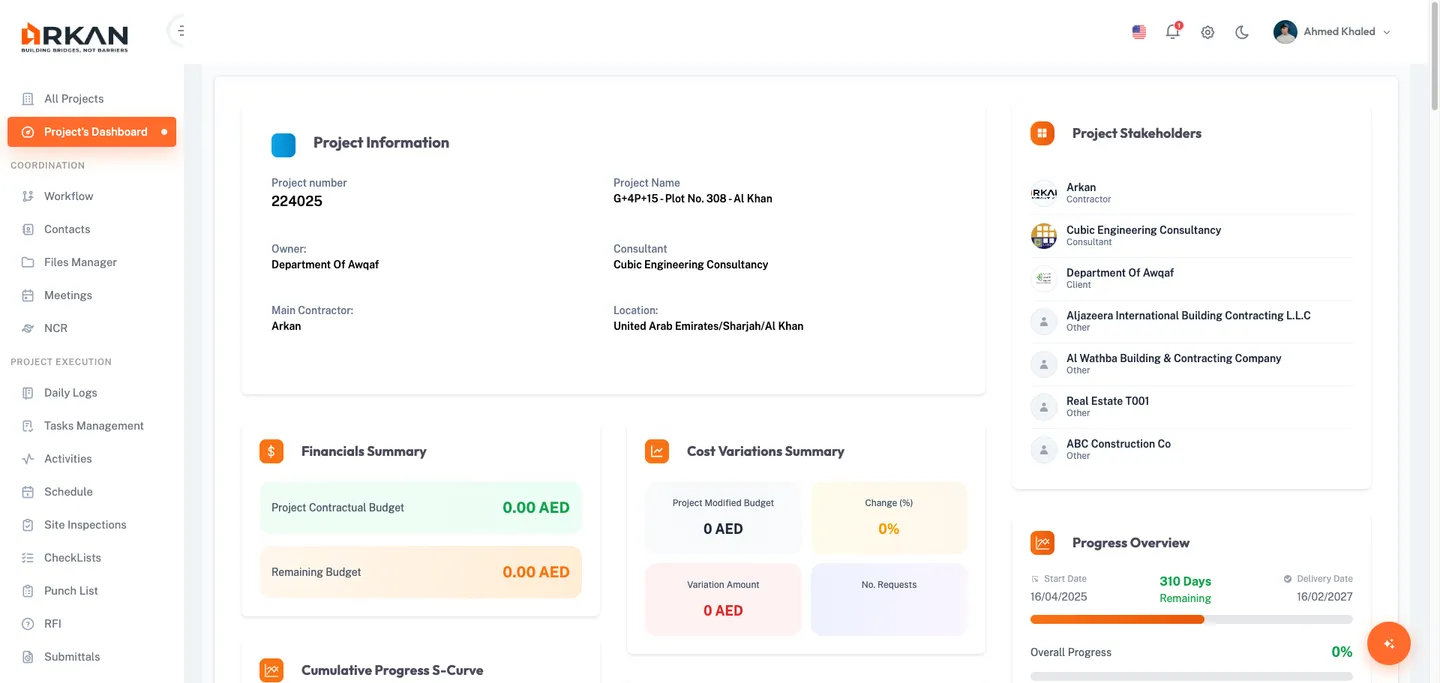
Cost Variations Summary
- Locate the Cost Variations Summary widget on the right side, adjacent to the Financial Summary.
- Review the four KPI cards arranged in a 2x2 grid:
- Project Modified Budget -- The adjusted budget after all approved variations.
- Change Percentage (amber) -- The percentage difference between the original and modified budget.
- Variation Amount (red) -- The total monetary value of all variations.
- No. of Requests (purple) -- The count of variation requests submitted.

Estimated Financial Projection
- Locate the Estimated Financial Projection widget in the right column, below the Activities Overview.
- Review the two indicators:
- Total Till Date (green) -- Cumulative financial amount spent or committed to date.
- Difference from Last Payment (blue) -- The monetary change since the most recent payment was processed.
Tip: Compare the Remaining Budget in the Financial Summary with the Total Till Date in the projection to assess whether the project is on track financially.
Cumulative Progress Curve
The Cumulative Progress Curve (S-Curve) visualizes project progress over the last 12 months.
- Locate the Cumulative Progress S-Curve widget below the Financial Summary.
- Review the three summary statistics above the chart:
- Current Progress -- The latest progress percentage.
- Contract Value -- The total contract value.
- Paid to Date -- The cumulative amount paid.
- Examine the line chart. The x-axis shows months and the y-axis shows progress or financial values.
The data is derived from monthly payment snapshots. Each point represents the cumulative value at the end of that month.
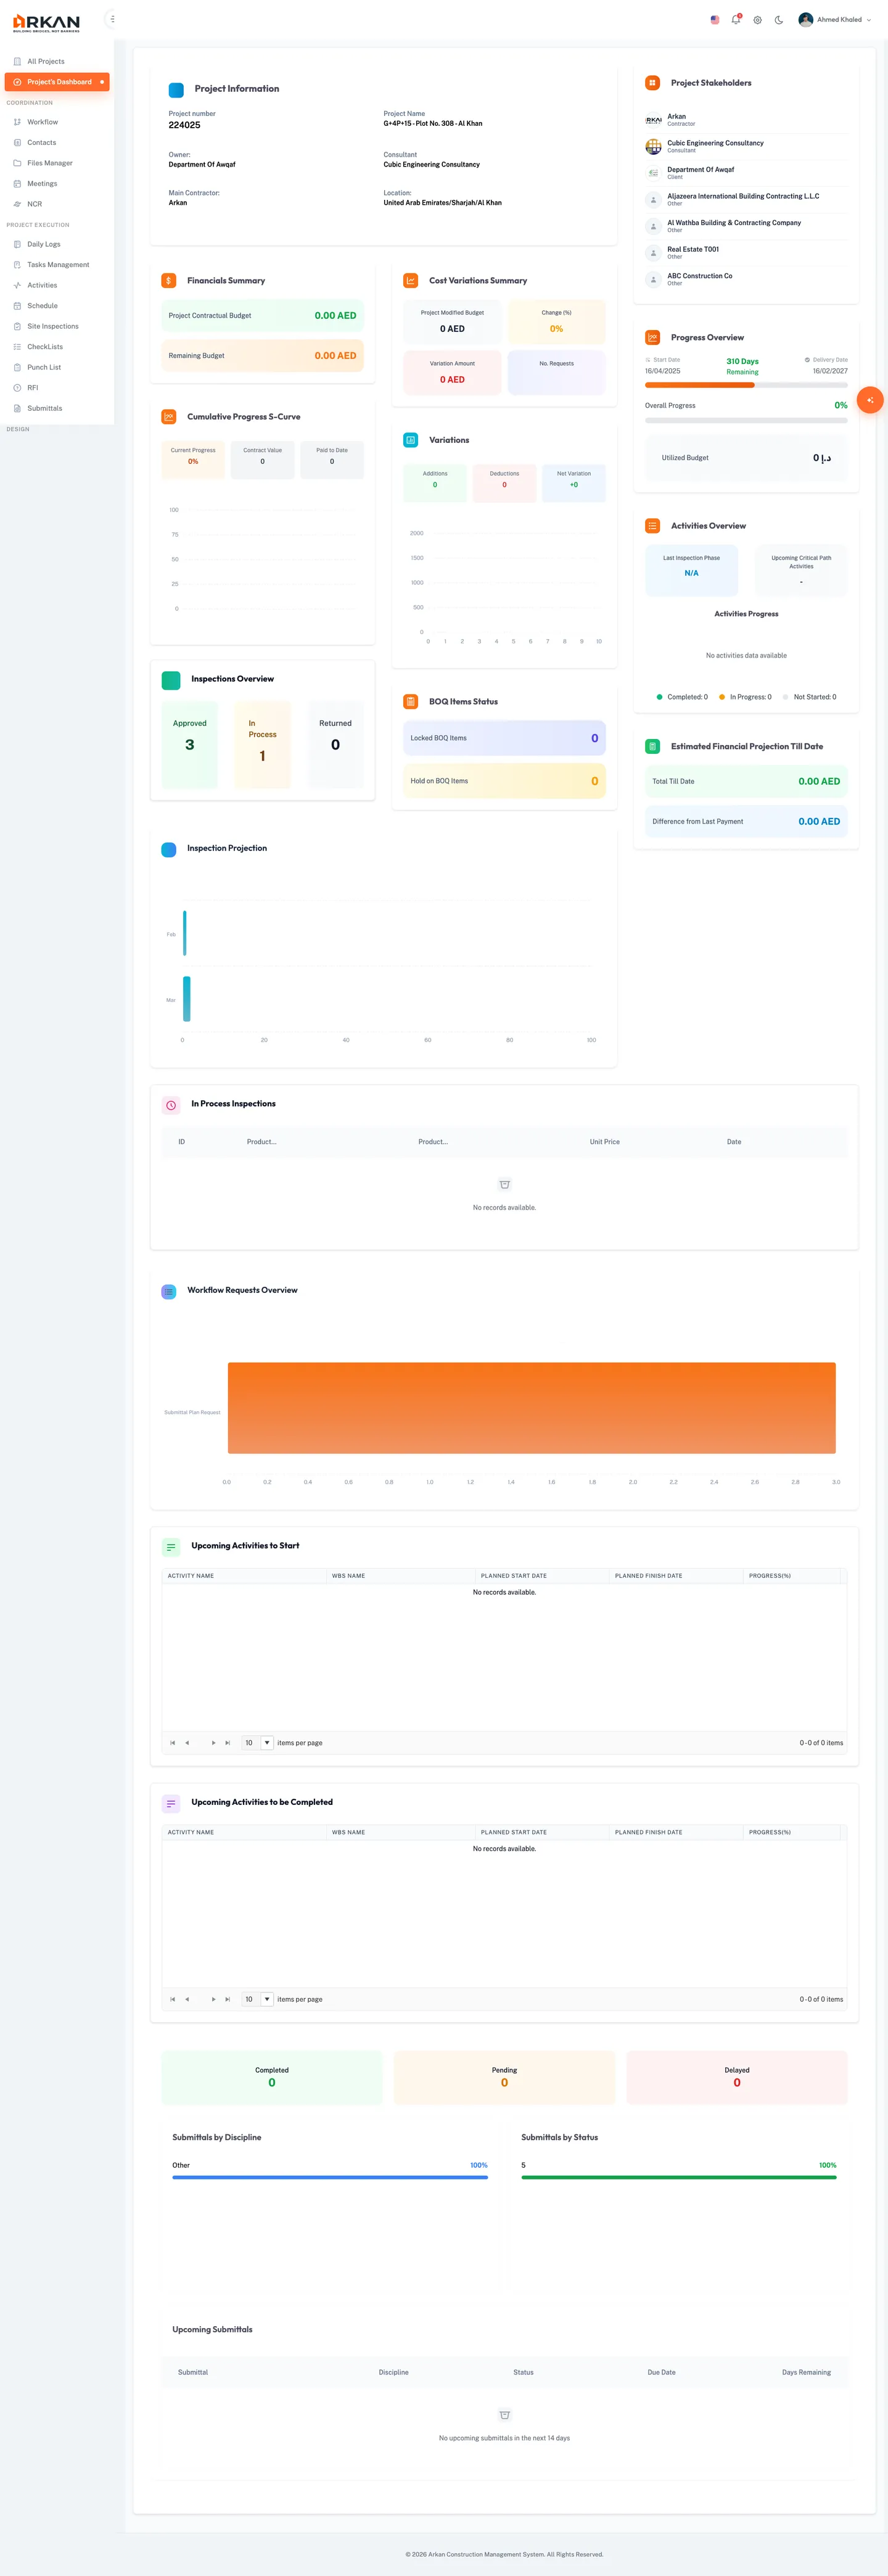
Schedule and Progress KPIs
Progress Overview
- Locate the Progress Overview widget in the right column.
- Review the three sections:
- Timeline Progress (orange bar) -- Shows how far along the project is based on calendar dates. The Start Date appears on the left, the Delivery Date on the right, and the center label shows either the number of remaining days or an overdue warning in red.
- Overall Progress (green bar) -- Shows the schedule-based completion percentage sourced from Primavera. The percentage appears to the right of the label.
- Utilized Budget -- Displays the total budget consumed based on BOQ data, shown in the project currency.
Warning: If the center label shows "Overdue by X Days" in red, the project has passed its planned delivery date. Escalate to the project manager immediately.
Activities Overview
- Locate the Activities Overview widget below the Progress Overview in the right column.
- Review the two information cards:
- Last Inspection Phase -- The name of the most recently inspected project phase.
- Upcoming Critical Path Activities -- The count of upcoming activities on the critical path.
- Below the cards, a donut chart shows the breakdown of activity completion statuses. Each segment is labeled with its status and count.
If no activity data is available, the chart area displays "No data available."

Inspection KPIs
Inspection Overview
- Locate the Inspection Overview widget below the Cumulative Progress Curve on the left side.
- Review the three status cards:
- Approved (green) -- The number of inspections that passed review.
- In Process (amber) -- The number of inspections currently under review.
- Returned (gray) -- The number of inspections sent back for correction.
Inspection Projection
- Scroll down to the Inspection Projection widget, which spans the full width of the left column.
- Review the bar/line chart that shows monthly inspection volumes and projected trends.
This chart helps you anticipate inspection workloads in upcoming months.
In-Process Inspection Table
- Scroll to the bottom row and locate the In-Process Inspections table.
- Review the tabular data showing inspections currently being processed.
- If there are no in-process inspections, the table displays "No records found."

Submittal KPIs
- Scroll to the Submittals Overview widget at the bottom of the dashboard.
- Review the three KPI cards at the top of the widget:
- Completed (green) -- The number of submittals that have been fully processed and approved.
- Pending (amber) -- The number of submittals currently under review or in progress.
- Delayed (red) -- The number of submittals that are overdue or were submitted late.
- Below the KPI cards, review two horizontal bar charts:
- By Discipline -- Groups submittals by their discipline (e.g., Architectural, Structural, MEP).
- By Status -- Groups submittals by their current workflow status.
- At the bottom, the Upcoming Submittals table lists submittals due within the next 14 days. Columns include:
- Submittal -- The submittal name
- Discipline -- The discipline type
- Status -- The current status
- Due Date -- The submission deadline
- Days Remaining -- The number of days until the due date
Click any row in the Upcoming Submittals table to view details about that submittal.

Tip: Use the Delayed count as an early warning. If delayed submittals are increasing, coordinate with discipline leads to unblock pending reviews.
Variations
- Locate the Variations widget on the right side of the main area, below the Cost Variations Summary.
- Review the three summary cards:
- Additions (green) -- Total monetary value of scope additions.
- Deductions (red) -- Total monetary value of scope deductions.
- Net Variation -- The net difference (positive in green, negative in red).
- Below the cards, a bar chart visualizes variations by category.
BOQ Items Status
- Locate the BOQ Items Status widget below the Variations widget on the right side.
- Review the two indicators:
- Locked BOQ Items (purple) -- The number of BOQ line items that have been locked and cannot be modified.
- Hold on BOQ Items (amber) -- The number of BOQ line items currently placed on hold.
Workflow Requests Overview
- Scroll to the bottom row and locate the Workflow Requests Overview chart.
- The stacked bar chart displays workflow request categories (e.g., Inspection, BOQ Variation, NOC, Payment) with color-coded status segments.
This chart provides a quick view of how many workflow requests are pending, approved, or rejected across all categories.
Upcoming Activities
The dashboard includes two activity grids in the bottom row.
Upcoming Activities to Start
- Locate the Upcoming Activities to Start grid in the bottom row.
- Review the Kendo grid with the following columns:
- Activity Name -- The name of the scheduled activity
- WBS Name -- The Work Breakdown Structure element
- Planned Start Date -- When the activity is scheduled to begin
- Planned Finish Date -- When the activity is scheduled to end
- Progress % -- Current completion percentage
- Click any column header to sort the grid.
- Use the pagination controls at the bottom to navigate pages or change the page size.
Upcoming Activities to Complete
- Locate the Upcoming Activities to Complete grid, directly below the previous grid.
- This grid shares the same column structure and controls as Upcoming Activities to Start, but focuses on activities approaching their finish date.
Tip: Activities appearing in both grids may indicate short-duration tasks that are starting and finishing within the same reporting period.
Project Stakeholders
- Locate the Project Stakeholders widget at the top of the right column.
- Each stakeholder entry displays:
- A company logo (or a placeholder icon if no logo is available)
- The company name
- The role (Owner, Consultant, or Contractor)
Stakeholder information is read-only on the dashboard. To update project companies, navigate to Project Settings.

Drilling Into Details
Several dashboard widgets serve as entry points to their respective modules.
| Widget | Action | Navigates To |
|---|---|---|
| Upcoming Submittals table | Click a submittal row | Submittal detail view |
| KPI summary areas | Click the relevant sidebar menu item | The corresponding module page |
To navigate from any KPI to its detailed module:
- Note the metric you want to explore (e.g., inspection counts).
- In the Sidebar, click the corresponding module (e.g., Site Inspections for inspection data, Finance for financial data, Submittals for submittal details).
The module page provides full filtering, search, and editing capabilities that are not available on the dashboard.
Tip: The dashboard is a read-only overview. To take action on any item (approve an inspection, respond to a submittal, process a payment), navigate to the relevant module using the sidebar.
Troubleshooting
The dashboard shows "Access Denied"
Your user role does not include the Dashboard -- Retrieve permission. Contact your administrator to update your role permissions.
A widget shows a loading spinner that never finishes
- Check your network connection.
- Try refreshing the browser page.
- If the issue persists, the backend API for that widget may be unavailable. Other widgets should continue to function normally since each section loads independently.
The dashboard shows "No project selected"
- Click All Projects in the sidebar.
- Select a project from the list.
- Navigate back to Dashboard.
Financial values appear as zero
The project may not have financial data configured yet. Verify that BOQ items and payment records have been entered in the Finance module.
The Progress Overview shows "Overdue"
The project has passed its planned delivery date. The orange timeline bar will show 100% and the center label will display the number of overdue days in red. Coordinate with the project manager to update the delivery date if an extension has been approved.
Charts display "No data available"
The underlying data source has not been populated. For example:
- Cumulative Progress Curve requires at least one month of payment data.
- Activities Overview requires Primavera schedule data to be imported.
- Submittals Overview requires submittals to be created in the project.
I see different data than my colleague
Dashboard data is project-specific. Ensure you both have the same project selected. Check the project name in the Project Information card at the top of the dashboard.
For additional help, see Troubleshooting & FAQ.
Previous: Projects -- Learn how to create and manage projects. Next: Submittals -- Learn how to create and track submittals.